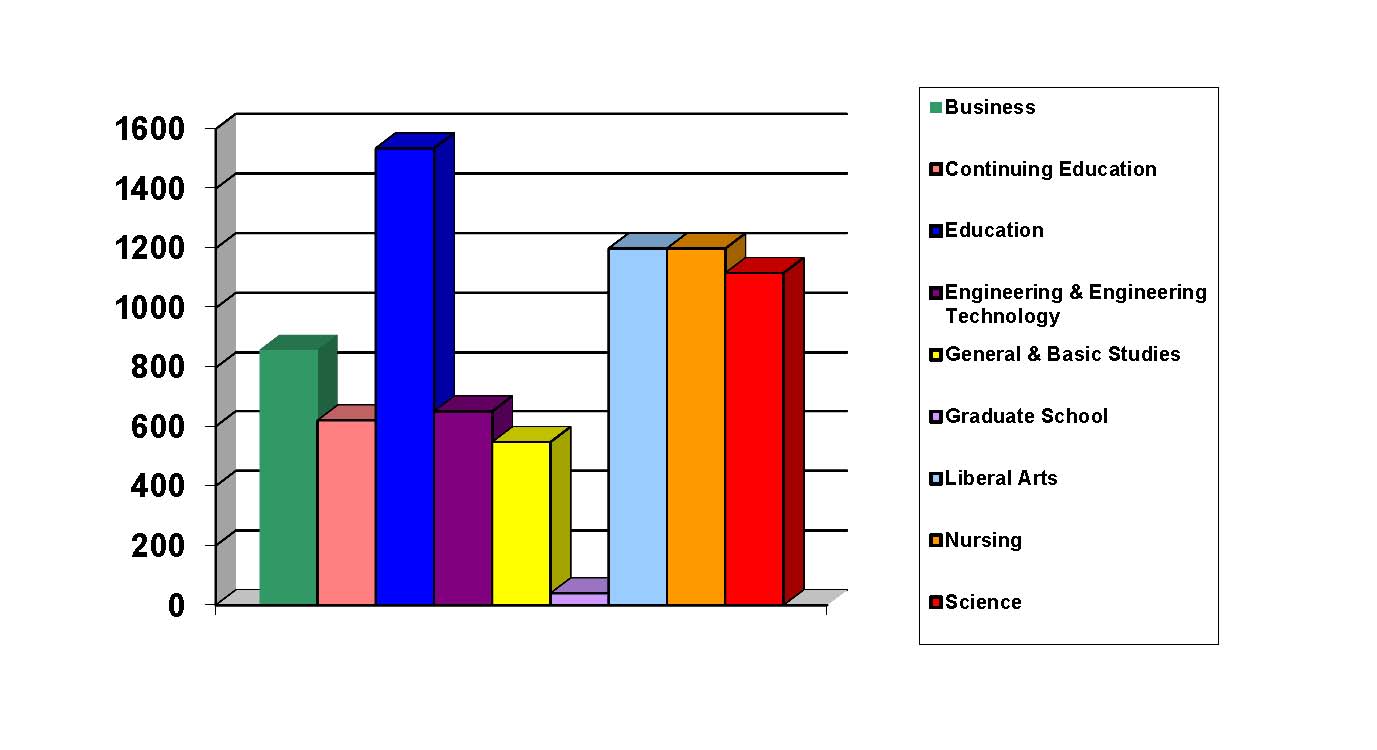
Spring 2013 Enrollment by College
Spring 2013 Enrollment by College
| Undergraduate | Graduate | Total | Percent | |
| Business | 786 | 74 | 860 | 11.1% |
| Continuing Education | 604 | 16 | 620 | 8.0% |
| Edcuation | 1,063 | 472 | 1,535 | 19.8% |
| Engineering & Engineering Technology | 627 | 23 | 650 | 8.4% |
| General & Basic Studies | 547 | 547 | 7.0% | |
| Graduate School | 40 | 40 | 0.5% | |
| Liberal Arts | 1,164 | 35 | 1,199 | 15.4% |
| Nursing | 1,071 | 128 | 1,199 | 15.4% |
| Science | 1,062 | 55 | 1,117 | 14.4% |
| Total | 6,924 | 843 | 7,767 | 100.0% |
Historical Spring Undergraduate Enrollment by College
| 2009 | 2010 | 2011 | 2012 | 2013 | |
| Business | 876 | 792 | 819 | 792 | 786 |
| Continuing Education | 21 | 435 | 670 | 600 | 604 |
| Education | 1,089 | 1,175 | 1,188 | 1,168 | 1,063 |
| Engineering & Engineering Technology | 539 | 534 | 559 | 589 | 627 |
| General & Basic Studies | 977 | 627 | 573 | 548 | 547 |
| Liberal Arts | 1,040 | 1,100 | 1,136 | 1,275 | 1,164 |
| Nursing | 1,034 | 1,169 | 1,180 | 1,124 | 1,071 |
| Science | 1,099 | 1,146 | 1,187 | 1,113 | 1,062 |
| Total | 6,675 | 6,978 | 7,312 | 7,209 | 6,924 |
Historical Spring Graduate Enrollment by College
| 2009 | 1010 | 2011 | 2012 | 2013 | |
| Business | 100 | 89 | 75 | 65 | 74 |
| Continuing Education | 15 | 16 | 13 | 10 | 16 |
| Education | 596 | 648 | 585 | 522 | 472 |
| Engineering & Engineering Technology | 57 | 63 | 50 | 34 | 23 |
| Graduate School | 61 | 87 | 64 | 66 | 40 |
| Liberal Arts | 39 | 32 | 35 | 33 | 35 |
| Nursing | 77 | 87 | 97 | 118 | 128 |
| Science | 77 | 99 | 82 | 79 | 55 |
| Total | 1,021 | 1,121 | 1,001 | 927 | 843 |
Spring 2013 Enrollment by College and Department
| College | Department Name | Undergraduate | Graduate | Total |
| Business | Accounting, Fin, & Economics | 332 | 332 | |
| Mgmt, Marketing and Gen Bus | 454 | 74 | 528 | |
| College of Business Total | 786 | 74 | 860 | |
| Continuing Education | Continuing Education | 604 | 16 | 620 |
| Continuing Education Total | 604 | 16 | 620 | |
| Education | Education Professions | 381 | 381 | |
| Graduate Education Programs | 228 | 228 | ||
| Health & Human Performance | 422 | 40 | 462 | |
| Psychology | 260 | 84 | 344 | |
| Student Teaching & Field Experience | 120 | 120 | ||
| College of Education Total | 1,063 | 472 | 1,535 | |
| Engineering & Engineering Technology | Engineering | 520 | 23 | 543 |
| Engineering Technology | 107 | 107 | ||
| College of Engineering & Engineering Technology Total | 627 | 23 | 650 | |
| General & Basic Studies | Basic Studies | 547 | 547 | |
| General & Basic Studies | 547 | 547 | ||
| Graduate School | Graduate School | 40 | 40 | |
| Graduate School Total | 40 | 40 | ||
| Liberal Arts | English & Foreign Languages | 106 | 35 | 141 |
| History | 110 | 110 | ||
| Mass Communication | 152 | 152 | ||
| Performing Arts | 120 | 120 | ||
| Social Sciences | 525 | 525 | ||
| Visual Arts | 151 | 151 | ||
| College of Liberal Arts Total | 1,164 | 35 | 1,199 | |
| Nursing | Graduate Nursing | 128 | 128 | |
| Undergraduate Nursing | 1,071 | 1,071 | ||
| College of Nursing Total | 1,071 | 128 | 1,199 | |
| Science | Agriculture | 333 | 24 | 357 |
| Biology & Health Sciences | 487 | 487 | ||
| Chemistry & Physics | 88 | 8 | 96 | |
| Math, Computer Science, & Stat | 154 | 23 | 177 | |
| College of Science Total | 1,062 | 55 | 1,117 | |
| University Total | 6,924 | 843 | 7,767 |
Spring 2013 Undergraduate Enrollment by College and Department
| College | Department Name | Full-Time | Part-Time | Total |
| Business | Accounting, Fin, & Economics | 291 | 41 | 332 |
| Mgmt, Marketing and Bus Admin | 386 | 68 | 454 | |
| College of Business Total | 677 | 109 | 786 | |
| Continuing Education | Continuing Education | 8 | 596 | 604 |
| Continuing Education Total | 8 | 596 | 604 | |
| Education | Education Professions | 323 | 58 | 381 |
| Health & Human Performance | 401 | 21 | 422 | |
| Psychology | 239 | 21 | 260 | |
| College of Education Total | 963 | 100 | 1,063 | |
| Engineering & Engineering Technology | Engineering | 452 | 68 | 520 |
| Engineering Technology | 93 | 14 | 107 | |
| College of Engineering & Engineering Technology Total | 545 | 82 | 627 | |
| General & Basic Studies | Basic Studies | 430 | 117 | 547 |
| General & Basic Studies Total | 430 | 117 | 547 | |
| Liberal Arts | English & Foreign Languages | 85 | 21 | 106 |
| History | 97 | 13 | 110 | |
| Mass Communication | 145 | 7 | 152 | |
| Performing Arts | 103 | 17 | 120 | |
| Social Sciences | 451 | 74 | 525 | |
| Visual Arts | 131 | 20 | 151 | |
| College of Liberal Arts Total | 1,012 | 152 | 1,164 | |
| Nursing | Undergraduate Nursing | 856 | 215 | 1,071 |
| College of Nursing Total | 856 | 215 | 1,017 | |
| Science | Agriculture | 316 | 17 | 333 |
| Biology & Health Sciences | 446 | 41 | 487 | |
| Chemistry & Physics | 80 | 8 | 88 | |
| Math, Computer Science, & Stat | 129 | 25 | 154 | |
| College of Science Total | 971 | 91 | 1,062 | |
| University Total | 5,462 | 1,462 | 6,924 |
Spring 2013 Graduate Enrollment by College and Department
| College | Department Name | Full-Time | Part-Time | Total |
| Business | Mgmt, Marketing and Bus Admin | 51 | 23 | 74 |
| College of Business Total | 51 | 23 | 74 | |
| Continuing Education | 1 | 15 | 16 | |
| Education | Graduate Education Programs | 51 | 177 | 228 |
| Health & Human Performance | 34 | 66 | 40 | |
| Psychology | 58 | 26 | 84 | |
| Student Teaching & Field Experience | 28 | 92 | 120 | |
| College of Education Total | 171 | 301 | 472 | |
| Engineering & Engineering Technology | Engineering | 10 | 13 | 23 |
| College of Engineering & Engineering Technology Total | 10 | 13 | 23 | |
| Graduate School | Graduate School | 12 | 28 | 40 |
| Graduate School Total | 12 | 28 | 40 | |
| Liberal Arts | English & Foreign Languages | 27 | 8 | 35 |
| College of Liberal Arts Total | 27 | 8 | 35 | |
| Nursing | Graduate Nursing | 14 | 114 | 128 |
| College of Nursing Total | 14 | 114 | 128 | |
| Science | Agriculture | 14 | 10 | 24 |
| Chemistry & Physics | 8 | 8 | ||
| Math, Computer Science, & Stat | 18 | 5 | 23 | |
| College of Science Total | 40 | 15 | 55 | |
| University Total | 326 | 517 | 843 |
Historical Spring Undergraduate Enrollment by College and Department
| College | Department | 2009 | 2010 | 2011 | 2012 | 2013 |
| Business | Accounting, Fin, & Economics | 352 | 340 | 348 | 347 | 332 |
| Mgmt, Marketing and Gen Bus | 524 | 452 | 471 | 445 | 454 | |
| College of Business Total | 876 | 792 | 819 | 792 | 786 | |
| Continuing Education | Continuing Education | 21 | 435 | 670 | 600 | 604 |
| Continuing Education Total | 21 | 435 | 670 | 600 | 604 | |
| Education | Educ Leadership & Instr Tech | 22 | 33 | 30 | ||
| Education Professions | 445 | 381 | ||||
| Health & Human Performance | 384 | 393 | 438 | 447 | 422 | |
| Psychology | 205 | 219 | 245 | 276 | 260 | |
| Teacher Education | 478 | 530 | 475 | |||
| College of Education Total | 1,089 | 1,175 | 1,188 | 1,168 | 1,063 | |
| Engineering & Engineering Technology | Engineering | 380 | 402 | 455 | 468 | 520 |
| Engineering Technology | 159 | 132 | 104 | 121 | 107 | |
| College of Engineering & Engineering Technology Total | 539 | 534 | 559 | 589 | 627 | |
| General & Basic Studies | Basic Studies | 977 | 627 | 573 | 548 | 547 |
| General & Basic Studies Total | 977 | 627 | 573 | 548 | 547 | |
| Liberal Arts | English & Foreign Languages | 139 | 146 | 152 | 158 | 106 |
| History | 139 | 142 | 140 | 144 | 110 | |
| Mass Communications | 158 | 156 | 180 | 172 | 152 | |
| Performing Arts | 105 | 107 | 124 | 102 | 120 | |
| Social Sciences | 322 | 368 | 370 | 545 | 525 | |
| Visual Arts | 177 | 181 | 170 | 154 | 151 | |
| College of Liberal Arts Total | 1,040 | 1,100 | 1,136 | 1,275 | 1,164 | |
| Nursing | Undergraduate Nursing | 1,034 | 1,169 | 1,180 | 1,124 | 1,071 |
| College of Nursing Total | 1,034 | 1,169 | 1,180 | 1,124 | 1,071 | |
| Science | Agriculture | 252 | 283 | 301 | 334 | 333 |
| Biological & Envr Sciences | 485 | |||||
| Biology & Health Sciences | 470 | 496 | 510 | 487 | ||
| Chemistry | 95 | 100 | 74 | 89 | 88 | |
| Math, Computer Science, & Stat | 162 | 169 | 174 | 175 | 154 | |
| Nutrition and Family Studies | 94 | 109 | 129 | |||
| Physics | 11 | 15 | 13 | 5 | ||
| College of Science Total | 1,099 | 1,146 | 1,187 | 1,113 | 1,062 | |
| University Total | 6,675 | 6,978 | 7,312 | 7,209 | 6,924 |
Historical Spring Graduate Enrollment by College and Department
| College | Department Name | 2009 | 2010 | 2011 | 2012 | 2013 |
| Business | Mgmt, Marketing and Bus Admin | 100 | 89 | 75 | 65 | 74 |
| College of Business Total | 100 | 89 | 75 | 65 | 74 | |
| Continuing Education | Continuing Education | 15 | 16 | 13 | 10 | 16 |
| Continuing Education Total | 15 | 16 | 13 | 10 | 16 | |
| Education | Educ Leadership & Instr Tech | 122 | 135 | 98 | ||
| Graduate Education Programs | 292 | 228 | ||||
| Health & Human Performance | 41 | 32 | 37 | 39 | 40 | |
| Psychology | 64 | 59 | 76 | 76 | 84 | |
| Teacher Education | 368 | 422 | 374 | |||
| Student Teaching & Field Experience | 115 | 120 | ||||
| College of Education Total | 595 | 648 | 585 | 522 | 472 | |
| Engineering & Engineering Technology | Engineering | 57 | 63 | 50 | 34 | 20 |
| College of Engineering & Engineering Technology Total | 57 | 63 | 50 | 34 | 20 | |
| Graduate School | Graduate School | 61 | 87 | 64 | 66 | 40 |
| Graduate School Total | 61 | 87 | 64 | 66 | 40 | |
| Liberal Arts | English & Foreign Languages | 35 | 30 | 35 | 33 | 35 |
| Performing Arts | 4 | 2 | ||||
| College of Liberal Arts Total | 39 | 32 | 35 | 33 | 35 | |
| Nursing | Graduate Nursing | 77 | 87 | 97 | 118 | 128 |
| College of Nursing Total | 77 | 87 | 97 | 118 | 128 | |
| Science | Agriculture | 25 | 33 | 31 | 36 | 24 |
| Chemistry & Physics | 15 | 20 | 21 | 19 | 8 | |
| Math, Computer Science, & Stat | 37 | 46 | 30 | 24 | 23 | |
| College of Science Total | 77 | 99 | 82 | 79 | 55 | |
| University Total | 1,021 | 1,121 | 1,001 | 927 | 843 |
Spring 2013 Enrollment by Department and Major
| College/Department | Major | Undergraduate | Graduate | Total |
| Business | ||||
| Accounting, Fin & Economics | Accounting | 252 | 252 | |
| Finance | 80 | 80 | ||
| Department Total | 332 | 332 | ||
| Mgmt, Marketing, & Bus Admin | Business Administration | 74 | 74 | |
| Gen Business Administration | 156 | 156 | ||
| Management | 159 | 159 | ||
| Management Online | 49 | 49 | ||
| Marketing | 90 | 90 | ||
| Department Total | 454 | 74 | 528 | |
| College of Business Total | 786 | 74 | 860 | |
| Continuing Education | ||||
| Continuing Education | EASE Program | 4 | 16 | 20 |
| High School Early Admissions | 600 | 600 | ||
| Department Total | 604 | 16 | 620 | |
| Continuing Education Total | 604 | 16 | 620 | |
| Education | ||||
| Education Professions | Business Education – Grades 6-12 | 7 | 7 | |
| Early Childhood Education | 1 | 1 | ||
| Early Childhood Educ – Grades PK-3 | 175 | 175 | ||
| Elementary Education – Grades 1-5 | 189 | 189 | ||
| Secondary Education and Teaching | 8 | 8 | ||
| Undeclared | 1 | 1 | ||
| Department Total | 381 | 381 | ||
| Graduate Education Programs | Counseling Gr K-12 | 2 | 2 | |
| Curriculum & Instruction | 13 | 13 | ||
| Educational Technology Leadership | 11 | 11 | ||
| Educational Leadership | 60 | 60 | ||
| Elementary Education Grades 1-5 | 31 | 31 | ||
| Instructional Technology | 22 | 22 | ||
| Reading Specialist | 3 | 3 | ||
| School Counseling | 41 | 41 | ||
| Secondary Education Grades 6-12 | 40 | 40 | ||
| Special Education | 3 | 3 | ||
| Department Total | 228 | 228 | ||
| Health & Human Performance | Athletic Training | 47 | 47 | |
| Health & Human Performance | 40 | 40 | ||
| Health & Human Performance, Education | 1 | 1 | ||
| Health & Human Performance, General | 250 | 250 | ||
| Health & Physical Education, Gr K-12 | 123 | 123 | ||
| Undeclared | 1 | 1 | ||
| Department Total | 422 | 40 | 462 | |
| Psychology | Psychology | 260 | 84 | 344 |
| Department Total | 260 | 84 | 344 | |
| Student Teaching and Field Experience | Add-On Teacher Certification | 13 | 13 | |
| Early Childhood Education Gr PK-3 (PBC) | 8 | 8 | ||
| Elementary Education Gr 1-5 (PBC) | 7 | 7 | ||
| ICrt-Early Childhood Ed Gr PK-3 | 11 | 11 | ||
| ICrt-Elementary Ed Gr 1-5 | 22 | 22 | ||
| ICrt-Mid Sch Ed Gr 4-8 [Sci] | 1 | 1 | ||
| ICrt-Mult Lvls Gr K-12 [Art] | 6 | 6 | ||
| ICrt-Mult Lvls Gr K-12 [HHP] | 11 | 11 | ||
| ICrt-Mult Lvls Gr K-12 [Musc] | 1 | 1 | ||
| ICrt-Sec Ed Gr 6-12 [Agri] | 4 | 4 | ||
| ICrt-Sec Ed Gr 6-12 [Biol] | 1 | 1 | ||
| ICrt-Sec Ed Gr 6-12 [Busi] | 2 | 2 | ||
| ICrt-Sec Ed Gr 6-12 [Engl] | 1 | 1 | ||
| ICrt-Sec Ed Gr 6-12 [French] | 2 | 2 | ||
| ICrt-Sec Ed Gr 6-12 [Gen Sci] | 1 | 1 | ||
| ICrt-Sec Ed Gr 6-12 [Soc Std] | 7 | 7 | ||
| ICrt-Sec Ed Gr 6-12 [Spanish] | 1 | 1 | ||
| Middle School Ed Gr 4-8 [Math] (PBC) | 1 | 1 | ||
| Multiple Levels Gr K-12 [HHP] (PBC) | 1 | 1 | ||
| School Librarian (PBC) | 7 | 7 | ||
| Secondary Ed Gr 6-12 [Busi] (PBC) | 1 | 1 | ||
| Secondary Ed Gr 6-12 [Gen Sci] (PBC) | 1 | 1 | ||
| Spec Ed M/Mod – Elem Ed Gr 1-5 (PBC) | 4 | 4 | ||
| Spec Ed M/Mod – Second Ed Gr 6-12 (PBC) | 3 | 3 | ||
| Spec Ed – Early Interv: Birth-5 (PBC) | 3 | 3 | ||
| Department Total | 120 | 120 | ||
| College of Education Total | 1,063 | 427 | 1,535 | |
| Engineering & Engineering Technology | ||||
| Engineering | Engineering | 520 | 23 | 543 |
| Department Total | 520 | 23 | 543 | |
| Engineering Technology | Engineering Technology | 107 | 107 | |
| Department Total | 107 | 107 | ||
| College of Engineering & Engineering Technology Total | 627 | 23 | 650 | |
| General & Basic Studies | ||||
| Basic Studies | Basic Studies | 79 | 79 | |
| General Studies | 468 | 468 | ||
| Department Total | 547 | 547 | ||
| General & Basic Studies Total | 547 | 547 | ||
| Graduate School | Non-Degree | 40 | 40 | |
| Department Total | 40 | 40 | ||
| Graduate School Total | 40 | 40 | ||
| Liberal Arts | ||||
| English & Foreign Languages | Creative Writing | 20 | 20 | |
| English | 71 | 15 | 86 | |
| English Education Grades 6-12 | 17 | 17 | ||
| Foreign Language Education Gr 6-12 | 1 | 1 | ||
| Foreign Languages | 15 | 15 | ||
| French | 1 | 1 | ||
| General Studies | 1 | 1 | ||
| Department Total | 106 | 35 | 141 | |
| History | History | 80 | 80 | |
| Liberal Studies | 25 | 25 | ||
| Social Studies Education Gr 6-12 | 5 | 5 | ||
| Department Total | 110 | 110 | ||
| Mass Communication | Mass Communication | 152 | 152 | |
| Department Total | 152 | 152 | ||
| Performing Arts | Liberal Studies | 8 | 8 | |
| Music | 69 | 69 | ||
| Music Educ – Instrumental, Gr K-12 | 22 | 22 | ||
| Music Educ – Vocal, Gr K-12 | 8 | 8 | ||
| Music Performance | 6 | 6 | ||
| Theatre Arts | 7 | 7 | ||
| Department Total | 120 | 120 | ||
| Social Sciences | Criminal Justice | 154 | 154 | |
| Criminal Justice Online | 95 | 95 | ||
| Family and Consumer Science | 19 | 19 | ||
| General Studies | 6 | 6 | ||
| Government | 38 | 38 | ||
| Paralegal Studies | 28 | 28 | ||
| Sociology | 58 | 58 | ||
| Sociology Online | 127 | 127 | ||
| Department Total | 525 | 525 | ||
| Visual Arts | Art | 142 | 142 | |
| Art Education – Grades K-12 | 7 | 7 | ||
| Gen Studies | 1 | 1 | ||
| Undeclared | 1 | 1 | ||
| Department Total | 151 | 151 | ||
| College of Liberal Arts Total | 1,164 | 35 | 1,199 | |
| Nursing | ||||
| Graduate Nursing | Family Psyc Nurse Prac | 1 | 1 | |
| Nursing | 127 | 127 | ||
| Department Total | 128 | 128 | ||
| Undergraduate Nursing | Nursing | 1,027 | 1,027 | |
| Nursing Online | 44 | 44 | ||
| Department Total | 1,071 | 1,071 | ||
| College of Nursing Total | 1,071 | 128 | 1,199 | |
| Science | ||||
| Agriculture | Agricultural Education – Grds 6-12 | 7 | 7 | |
| Agricultural Sciences | 226 | 226 | ||
| Environmental & Chemical Sciences | 24 | 24 | ||
| Environmental Science | 1 | 1 | ||
| Family and Consumer Science | 7 | 7 | ||
| Natural Resource Conservation Mgmt | 58 | 58 | ||
| Nutrition and Food Science | 31 | 31 | ||
| Secondary Education and Teaching | 3 | 3 | ||
| Department Total | 333 | 24 | 357 | |
| Biology & Health Sciences | Biological Science | 226 | 226 | |
| Biology Education – Grades 6-12 | 4 | 4 | ||
| Clinical Laboratory Science | 69 | 69 | ||
| Radiologic Sciences | 188 | 188 | ||
| Department Total | 487 | 487 | ||
| Chemistry & Physics | Chemistry | 86 | 86 | |
| Environmental & Chemical Sciences | 8 | 8 | ||
| Physics | 1 | 1 | ||
| Secondary Education and Teaching | 1 | 1 | ||
| Department Total | 88 | 8 | 96 | |
| Math, Comp Sci and Stat | Computer Information Tech | 15 | 15 | |
| Computer Science | 82 | 82 | ||
| Mathematical Sciences | 52 | 23 | 75 | |
| Mathematics | 3 | 3 | ||
| Mathematics Education – Grades 6-12 | 2 | 2 | ||
| Department Total | 154 | 23 | 177 | |
| College of Science Total | 1,062 | 55 | 1,117 | |
| University Total | 6,924 | 843 | 7,767 |