Fall 2012 Enrollment by College
Fall 2012 Enrollment by College
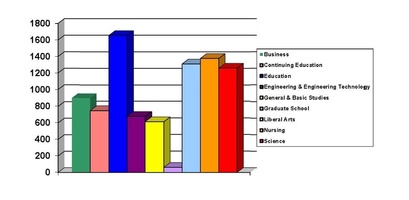
| Undergraduate | Graduate | Total | Percent | |
| Business | 817 | 81 | 898 | 10.4% |
| Continuing Education | 729 | 14 | 743 | 8.7% |
| Education | 1,179 | 474 | 1,653 | 19.2% |
| Engineering & Engineering Technology | 651 | 24 | 675 | 7.9% |
| General & Basic Studies | 610 | 610 | 7.1% | |
| Graduate School | 62 | 62 | 0.7% | |
| Liberal Arts | 1,272 | 38 | 1,310 | 15.3% |
| Nursing | 1,254 | 123 | 1,377 | 16.0% |
| Science | 1,199 | 61 | 1,260 | 14.7% |
| Total | 7,711 | 877 | 8,588 | 100.0% |
Historical Fall Undergraduate Enrollment by College
| 2008 | 2009 | 2010 | 2011 | 2012 | |
| Business | 1,013 | 871 | 849 | 840 | 817 |
| Continuing Education | 10 | 505 | 709 | 668 | 729 |
| Education | 1,143 | 1,214 | 1,239 | 1,221 | 1,179 |
| Engineering & Engineering Technology | 579 | 582 | 624 | 611 | 651 |
| General & Basic Studies | 1,099 | 749 | 685 | 624 | 610 |
| Liberal Arts | 1,037 | 1,113 | 1,185 | 1,290 | 1,272 |
| Nursing | 1,181 | 1,244 | 1,329 | 1,292 | 1,254 |
| Science | 1,220 | 1,257 | 1,261 | 1,256 | 1,199 |
| Total | 7,282 | 7,535 | 7,881 | 7,802 | 7,711 |
Historical Fall Graduate Enrollment by College
| 2008 | 2009 | 2010 | 2011 | 2012 | |
| Business | 99 | 105 | 87 | 77 | 81 |
| Continuing Education | 12 | 11 | 11 | 10 | 14 |
| Education | 567 | 622 | 636 | 581 | 474 |
| Engineering & Engineering Technology | 71 | 80 | 55 | 39 | 24 |
| Graduate School | 77 | 71 | 66 | 69 | 62 |
| Liberal Arts | 38 | 34 | 35 | 36 | 38 |
| Nursing | 88 | 89 | 84 | 104 | 123 |
| Science | 660 | 98 | 86 | 73 | 61 |
| Total | 1,012 | 1,110 | 1,060 | 989 | 877 |
Fall 2012 Enrollment by College and Department
| College | Department Name | Undergraduate | Graduate | Total |
| Business | Accounting, Fin, & Economics | 342 | 342 | |
| Mgmt, Marketing and Bus Admin | 475 | 81 | 556 | |
| College of Business Total | 817 | 81 | 898 | |
| Continuing Education | Continuing Education | 729 | 14 | 743 |
| Continuing Education Total | 729 | 14 | 743 | |
| Education | Education Professions | 412 | 412 | |
| Graduate Education Programs | 240 | 240 | ||
| Health & Human Performance | 477 | 49 | 526 | |
| Psychology | 290 | 76 | 366 | |
| Student Teaching & Field Experience | 109 | 109 | ||
| College of Education Total | 1,179 | 474 | 1,653 | |
| Engineering & Engineering Technology | Engineering | 534 | 24 | 558 |
| Engineering Technology | 117 | 117 | ||
| College of Engineering & Engineering Technology Total | 651 | 24 | 675 | |
| General & Basic Studies | Basic Studies | 610 | 610 | |
| General & Basic Studies Total | 610 | 610 | ||
| Graduate School | Graduate School | 62 | 62 | |
| Graduate School Total | 62 | 62 | ||
| Liberal Arts | English & Foreign Languages | 130 | 38 | 168 |
| History | 137 | 137 | ||
| Mass Communication | 170 | 170 | ||
| Performing Arts | 125 | 125 | ||
| Social Sciences | 547 | 547 | ||
| Visual Arts | 163 | 163 | ||
| College of Liberal Arts Total | 1,272 | 38 | 1,310 | |
| Nursing | Graduate Nursing | 123 | 123 | |
| Undergraduate Nursing | 1,254 | 1,254 | ||
| College of Nursing Total | 1,254 | 123 | 1,377 | |
| Science | Agriculture | 362 | 26 | 388 |
| Biology & Health Sciences | 571 | 571 | ||
| Chemistry & Physics | 97 | 15 | 112 | |
| Math, Computer Science, & Stat | 169 | 20 | 189 | |
| College of Science Total | 1,199 | 61 | 1,260 | |
| University Total | 7,711 | 877 | 8,588 |
Fall 2012 Undergraduate Enrollment by College and Department
| College | Department Name | Full-Time | Part-Time | Total |
| Business | Accounting, Fin, & Economics | 302 | 40 | 342 |
| Mgmt, Marketing and Bus Admin | 405 | 70 | 475 | |
| College of Business Total | 707 | 110 | 817 | |
| Continuing Education | Continuing Education | 7 | 722 | 729 |
| Continuing Education Total | 7 | 722 | 729 | |
| Education | Education Professions | 347 | 65 | 412 |
| Health & Human Performance | 444 | 33 | 477 | |
| Psychology | 255 | 35 | 290 | |
| College of Education Total | 1,046 | 133 | 1,179 | |
| Engineering & Engineering Technology | Engineering | 485 | 49 | 534 |
| Engineering Technology | 90 | 27 | 117 | |
| College of Engineering & Engineering Technology Total | 575 | 76 | 651 | |
| General & Basic Studies | Basic Studies | 516 | 94 | 610 |
| General & Basic Studies Total | 516 | 94 | 610 | |
| Liberal Arts | English & Foreign Languages | 118 | 12 | 130 |
| History | 121 | 16 | 137 | |
| Mass Communication | 162 | 8 | 170 | |
| Performing Arts | 113 | 12 | 125 | |
| Social Sciences | 488 | 59 | 547 | |
| Visual Arts | 142 | 21 | 163 | |
| College of Liberal Arts Total | 1,144 | 128 | 1,272 | |
| Nursing | Undergraduate Nursing | 992 | 262 | 1,254 |
| College of Nursing Total | 992 | 262 | 1,254 | |
| Science | Agriculture | 344 | 18 | 362 |
| Biology & Health Science | 512 | 59 | 571 | |
| Chemistry & Physics | 91 | 6 | 97 | |
| Math, Computer Science, & Stat | 148 | 21 | 169 | |
| College of Science Total | 1,095 | 104 | 1,199 | |
| University Total | 6,082 | 1,629 | 7,711 |
Fall 2012 Graduate Enrollment by College and Department
| College | Department Name | Full-Time | Part-Time | Total |
| Business | Mgmt, Marketing and Bus Admin | 50 | 31 | 81 |
| College of Business Total | 50 | 31 | 81 | |
| Continuing Education | Continuing Education | 1 | 13 | 14 |
| Continuing Education Total | 1 | 13 | 14 | |
| Education | Graduate Education Programs | 53 | 187 | 240 |
| Health & Human Performance | 44 | 5 | 49 | |
| Psychology | 48 | 28 | 76 | |
| Student Teaching & Field Experience | 18 | 91 | 109 | |
| College of Education Total | 163 | 311 | 474 | |
| Engineering & Engineering Technology | Engineering | 13 | 11 | 24 |
| College of Engineering & Engineering Technology Total | 13 | 11 | 24 | |
| Graduate School | Graduate School | 20 | 42 | 62 |
| Graduate School Total | 20 | 42 | 62 | |
| Liberal Arts | English & Foreign Languages | 30 | 8 | 38 |
| College of Liberal Arts Total | 30 | 8 | 38 | |
| Nursing | Graduate Nursing | 15 | 108 | 123 |
| College of Nursing Total | 15 | 108 | 123 | |
| Science | Agriculture | 17 | 9 | 26 |
| Chemistry & Physics | 14 | 1 | 15 | |
| Math, Computer Science, & Stat | 17 | 3 | 20 | |
| College of Science Total | 48 | 13 | 61 | |
| University Total | 340 | 537 | 877 |
Historical Fall Undergraduate Enrollment by College and Department
| College | Department Name | 2008 | 2009 | 2010 | 2011 | 2012 |
| Business | Accounting, Fin, & Economics | 349 | 342 | 348 | 361 | 342 |
| Mgmt, Marketing and Gen Bus | 664 | 529 | 501 | 479 | 475 | |
| College of Business Total | 1,013 | 871 | 849 | 840 | 817 | |
| Continuing Education | Continuing Education | 10 | 505 | 709 | 668 | 729 |
| Continuing Education Total | 10 | 505 | 709 | 668 | 729 | |
| Education | Education Professions | 487 | 412 | |||
| Educ Leadership & Instr Tech | 20 | 29 | 30 | |||
| Health & Human Performance | 394 | 418 | 436 | 448 | 477 | |
| Psychology | 238 | 241 | 245 | 286 | 290 | |
| Teacher Education | 491 | 526 | 528 | |||
| College of Education Total | 1,143 | 1,214 | 1,239 | 1,221 | 1,179 | |
| Engineering & Engineering Technology | Engineering | 409 | 430 | 489 | 501 | 534 |
| Engineering Technology | 170 | 152 | 135 | 110 | 117 | |
| College of Engineering & Engineering Technology Total | 579 | 582 | 624 | 611 | 651 | |
| General & Basic Studies | Basic Studies | 1,099 | 749 | 685 | 624 | 610 |
| Gen & Basic Studies Total | 1,099 | 749 | 685 | 624 | 610 | |
| Liberal Arts | English & Foreign Languages | 141 | 134 | 173 | 164 | 130 |
| History | 129 | 150 | 154 | 137 | 137 | |
| Mass Communications | 164 | 164 | 175 | 176 | 170 | |
| Performing Arts | 104 | 120 | 131 | 121 | 125 | |
| Social Sciences | 327 | 367 | 372 | 527 | 547 | |
| Visual Arts | 172 | 178 | 180 | 165 | 163 | |
| College of Liberal Arts Total | 1,037 | 1,113 | 1,185 | 1,290 | 1,272 | |
| Nursing | Undergraduate Nursing | 1,181 | 1,244 | 1,329 | 1,292 | 1,254 |
| College of Nursing Total | 1,181 | 1,244 | 1,329 | 1,292 | 1,254 | |
| Science | Agriculture | 236 | 305 | 307 | 380 | 362 |
| Biological & Envr Sciences | 600 | |||||
| Biology & Health Sciences | 532 | 533 | 572 | 571 | ||
| Chemistry | 108 | 111 | 90 | 106 | ||
| Chemistry & Physics | 97 | |||||
| Math, Computer Science, & Stat | 170 | 180 | 190 | 190 | 169 | |
| Nutrition and Family Studies | 97 | 110 | 123 | |||
| Physics | 9 | 19 | 18 | 8 | ||
| College of Science Total | 1,220 | 1,257 | 1,261 | 1,256 | 1,199 | |
| University Total | 7,282 | 7,535 | 7,881 | 7,802 | 7,711 |
^In Fall 2009 Environmental Science enrollment was moved from Biological & Environmental Sciences to Agriculture.
In Fall 2011 Educ Leadership & Instr Tech and Teacher Education were combined into Education Professions.
%In Fall 2011 Nutrition and Family Studies was split between Social Sciences and Agriculture.
~In Fall 2012 Chemistry and Physics were combined into Chemistry & Physics.
Historical Fall Graduate Enrollment by College and Department
| College | Department Name | 2008 | 2009 | 2010 | 2011 | 2012 |
| Business | Mgmt, Marketing and Gen Bus | 99 | 105 | 87 | 77 | 81 |
| College of Business Total | 99 | 105 | 87 | 77 | 81 | |
| Continuing Education | Continuing Education | 12 | 11 | 11 | 10 | 14 |
| Continuing Education | 12 | 11 | 11 | 10 | 14 | |
| Education | Education Professions | 188 | ||||
| Educ Leadership & Instr Tech | 115 | 124 | 126 | |||
| Graduate Education Programs | 240 | |||||
| Health & Human Performance | 39 | 46 | 48 | 53 | 49 | |
| Psychology | 63 | 64 | 75 | 81 | 76 | |
| Student Teaching and Field Experience | 259 | 109 | ||||
| Teacher Education | 350 | 388 | 387 | |||
| College of Education Total | 567 | 622 | 636 | 581 | 474 | |
| Engineering & Engineering Technology | Engineering | 71 | 80 | 55 | 39 | 24 |
| College of Engineering & Engineering Technology Total | 71 | 80 | 55 | 39 | 24 | |
| Graduate School | Graduate School | 77 | 71 | 66 | 69 | 62 |
| Graduate School | 77 | 71 | 66 | 69 | 62 | |
| Liberal Arts | English & Foreign Languages | 33 | 30 | 34 | 36 | 38 |
| Performing Arts | 5 | 4 | 1 | |||
| College of Liberal Arts Total | 38 | 34 | 35 | 36 | 38 | |
| Nursing | Graduate Nursing | 88 | 89 | 84 | 104 | 123 |
| College of Nursing Total | 88 | 89 | 84 | 104 | 123 | |
| Science | Agriculture | 11 | 25 | 34 | 33 | 26 |
| Biological & Envr Sciences | 9 | |||||
| Chemistry | 14 | 18 | 14 | 17 | 15 | |
| Math, Computer Science, & Stat | 26 | 55 | 38 | 23 | 20 | |
| College of Science Total | 60 | 98 | 86 | 73 | 61 | |
| University Total | 1,012 | 1,110 | 1,060 | 989 | 877 |
Fall 2012 Enrollment by Department and Major
| College/Department | Major | Undergraduate | Graduate | Total |
| Business | ||||
| Accounting, Fin & Economics | Accounting | 258 | 258 | |
| Finance | 84 | 84 | ||
| Department Total | 342 | 342 | ||
| Mgmt, Marketing, & Gen Bus | Business Administration | 81 | 81 | |
| Gen Business Administration | 177 | 177 | ||
| Management | 174 | 174 | ||
| Management Online | 32 | 32 | ||
| Marketing | 91 | 91 | ||
| Undeclared | 1 | 1 | ||
| Department Total | 475 | 81 | 556 | |
| College of Business Total | 817 | 81 | 898 | |
| Continuing Education | ||||
| Continuing Education | EASE Program | 2 | 14 | 2 |
| High School Early Admissions | 727 | 727 | ||
| Department Total | 729 | 729 | ||
| Continuing Education Total | 729 | 14 | 743 | |
| Education | ||||
| Education Professions | Business Education – Grades 6-12 | 11 | 11 | |
| Early Childhood Educ- Grades PK-3 | 186 | 186 | ||
| Elementary Education – Grades 1-5 | 206 | 206 | ||
| Secondary Education and Teaching | 9 | 9 | ||
| Department Total | 412 | 412 | ||
| Graduate Education Programs | Counseling Gr K-12 | 2 | 2 | |
| Curriculum & Instruction | 15 | 15 | ||
| Educational Technology Leadership | 13 | 13 | ||
| Educational Diagnostician | 1 | 1 | ||
| Educational Leadership | 60 | 60 | ||
| Elementary Education Grades 1-5 | 37 | 37 | ||
| Instructional Technology | 26 | 26 | ||
| Reading Specialist | 2 | 2 | ||
| School Counseling | 34 | 34 | ||
| Secondary Education Grades 6-12 | 46 | 46 | ||
| Special Education | 4 | 4 | ||
| Department Total | 240 | 240 | ||
| Health & Human Performance | Athletic Training | 73 | 73 | |
| Health & Human Performance | 49 | 49 | ||
| Health & Human Performance, Education | 1 | 1 | ||
| Health & Human Performance, General | 259 | 259 | ||
| Health & Physical Education, Gr K-12 | 144 | 144 | ||
| Department Total | 477 | 49 | 526 | |
| Psychology | Psychology | 290 | 76 | 366 |
| Department Total | 290 | 76 | 366 | |
| Student Teaching and Field Experience | Add-On Teacher Certification | 7 | 7 | |
| Alt Certification – Grades K-12 Health & Physical Ed | 11 | 11 | ||
| Alt Certification Grades 1-5 | 29 | 29 | ||
| Alt Certification Grades 6-12 | 27 | 27 | ||
| Alt Certification Grades K-12 Art Ed | 3 | 3 | ||
| Alt Certification PK-3 | 17 | 17 | ||
| School Librarian (Add on Cert) | 9 | 9 | ||
| Special Education Mild/Mod – Elem Ed Grades 1-5 | 2 | 2 | ||
| Special Education, Early Interv: Birth-5 | 4 | 4 | ||
| Department Total | 109 | 109 | ||
| College of Education Total | 1,179 | 474 | 1,653 | |
| Engineering & Engineering Technology | ||||
| Engineering | Engineering | 533 | 24 | 557 |
| Undeclared | 1 | 1 | ||
| Department Total | 534 | 24 | 558 | |
| Engineering Technology | Engineering Technology | 117 | 117 | |
| Department Total | 117 | 117 | ||
| College of Engineering & Engineering Technology Total | 651 | 24 | 675 | |
| General & Basic Studies | ||||
| Basic Studies | Basic Studies | 161 | 161 | |
| General Studies | 448 | 448 | ||
| Undeclared | 1 | 1 | ||
| Department Total | 610 | 610 | ||
| General & Basic Studies Total | 610 | 610 | ||
| Graduate School | Non-Degree | 62 | 62 | |
| Department Total | 62 | 62 | ||
| Graduate School Total | 62 | 62 | ||
| Liberal Arts | ||||
| English & Foreign Laguages | Creative Writing | 21 | 21 | |
| English | 83 | 17 | 100 | |
| English Education Grades 6-12 | 25 | 25 | ||
| Foreign Language Education Gr 6-12 | 2 | 2 | ||
| Foreign Languages | 15 | 15 | ||
| French | 1 | 1 | ||
| General Studies | 3 | 3 | ||
| Spanish | 1 | 1 | ||
| Department Total | 130 | 38 | 168 | |
| History | History | 89 | 89 | |
| Liberal Studies | 40 | 40 | ||
| Social Studies Education Gr 6-12 | 8 | 8 | ||
| Department Total | 137 | 137 | ||
| Mass Communication | Communication Studies | 2 | 2 | |
| Mass Communication | 168 | 168 | ||
| Department Total | 170 | 170 | ||
| Performing Arts | Liberal Studies | 8 | 8 | |
| Music | 64 | 64 | ||
| Music Education | 1 | 1 | ||
| Music Educ – Instrumental, Gr K-12 | 27 | 27 | ||
| Music Educ – Vocal, Gr K-12 | 12 | 12 | ||
| Music Performance | 6 | 6 | ||
| Theatre Arts | 7 | 7 | ||
| Department Total | 125 | 125 | ||
| Social Sciences | Criminal Justice | 186 | 186 | |
| Criminal Justice Online | 80 | 80 | ||
| Family and Consumer Sciences | 28 | 28 | ||
| General Studies | 7 | 7 | ||
| Government | 35 | 35 | ||
| Paralegal Studies | 25 | 25 | ||
| Sociology | 62 | 62 | ||
| Sociology Online | 124 | 124 | ||
| Department Total | 547 | 547 | ||
| Visual Arts | Art | 147 | 147 | |
| Art Education | 1 | 1 | ||
| Art Education – Grades K-12 | 15 | 15 | ||
| Department Total | 163 | 163 | ||
| College of Liberal Arts Total | 1,272 | 38 | 1,310 | |
| Nursing | ||||
| Graduate Nursing | Nursing | 123 | 123 | |
| Department Total | 123 | 123 | ||
| Undergraduate Nursing | Nursing | 1,224 | 1,224 | |
| Nursing Online Program | 30 | 30 | ||
| Department Total | 1,254 | 1,254 | ||
| College of Nursing Total | 1,254 | 1,254 | ||
| Science | ||||
| Agriculture | Agricultural Education – Grs 6-12 | 7 | 7 | |
| Agricultural Sciences | 256 | 256 | ||
| Environmental & Chemical Sciences | 26 | 26 | ||
| Environmental Sciences | 1 | 1 | ||
| Family and Consumer Science | 8 | 8 | ||
| Natural Resource Conservation Mgmt | 56 | 56 | ||
| Nutrition and Food Science | 30 | 30 | ||
| Secondary Education and Teaching | 1 | 1 | ||
| Undeclared | 1 | 1 | ||
| Wildlife Management | 2 | 2 | ||
| Department Total | 362 | 26 | 388 | |
| Biology & Health Sciences | Biological Science | 286 | 286 | |
| Biology Education – Grades 6-12 | 5 | 5 | ||
| Clinical Laboratory Science | 63 | 63 | ||
| Radiologic Technology | 216 | 216 | ||
| Undeclared | 2 | 2 | ||
| Department Total | 571 | 571 | ||
| Chemistry & Physics | Chemistry | 91 | 91 | |
| Mathematical Sciences | 2 | 2 | ||
| Environmental & Chemical Sciences | 15 | 15 | ||
| Physics | 1 | 1 | ||
| Secondary Education and Teaching | 3 | 3 | ||
| Department Total | 97 | 15 | 112 | |
| Math, Comp Sci and Stat | Computer Information Tech | 15 | 15 | |
| Computer Science | 90 | 90 | ||
| Mathematical Sciences | 53 | 20 | 73 | |
| Mathematics | 7 | 7 | ||
| Mathematics Education – Grades 6-12 | 3 | 3 | ||
| Undeclared | 1 | 1 | ||
| Department Total | 169 | 20 | 189 | |
| College of Science Total | 1,199 | 61 | 1,260 | |
| University Total | 7,711 | 877 | 8,588 |
| Undergraduates Taking Developmental Classes | 431 | 5.60% |