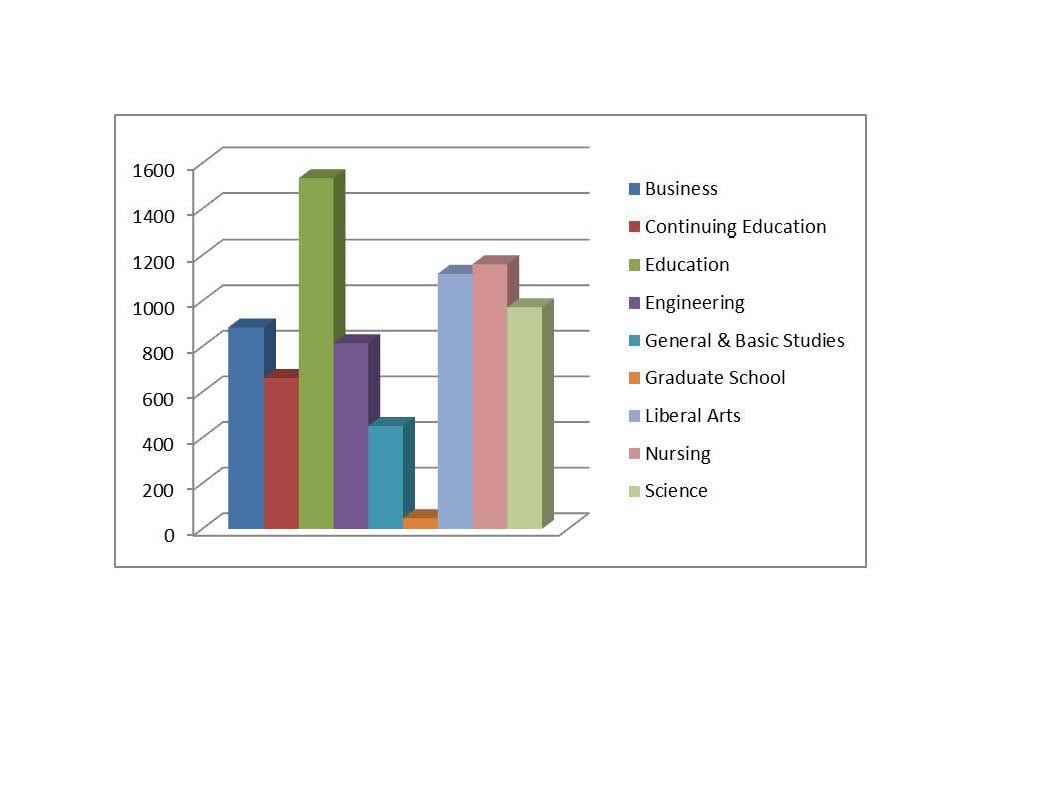
Spring 2014 Enrollment by College
Spring 2014 Enrollment by College
| Undergraduate | Graduate | Total | Percent | |
| Business | 821 | 63 | 884 | 11.6% |
| Continuing Education | 650 | 12 | 662 | 8.7% |
| Education | 1,095 | 439 | 1,534 | 20.0% |
| Engineering | 775 | 40 | 815 | 10.7% |
| General & Basic Studies | 452 | 452 | 5.95 | |
| Graduate School | 47 | 47 | 0.6% | |
| Liberal Arts | 1,078 | 41 | 1,119 | 14.6% |
| Nursing | 1,027 | 134 | 1,161 | 15.2% |
| Science | 929 | 43 | 972 | 12.7% |
| Total | 6,827 | 819 | 7,646 | 100.0 |
Historical Spring Undergraduate Enrollment by College
| 2010 | 2011 | 2012 | 2013 | 2014 | |
| Business | 792 | 819 | 792 | 786 | 821 |
| Continuing Education | 435 | 670 | 600 | 604 | 650 |
| Education | 1,175 | 1,188 | 1,168 | 1,063 | 1,095 |
| Engineering | 534 | 559 | 589 | 627 | 775 |
| General & Basic Studies | 627 | 573 | 548 | 547 | 452 |
| Liberal Arts | 1,100 | 1,136 | 1,275 | 1,164 | 1,078 |
| Nursing | 1,169 | 1,180 | 1,124 | 1,071 | 1,027 |
| Science | 1,146 | 1,187 | 1,113 | 1,062 | 929 |
| Total | 6,978 | 7,312 | 7,209 | 6,924 | 6,927 |
Historical Spring Graduate Enrollment by College
| 2010 | 2011 | 2012 | 2013 | 2014 | |
| Business | 89 | 75 | 65 | 74 | 63 |
| Continuing Education | 16 | 13 | 10 | 16 | 12 |
| Education | 648 | 585 | 522 | 472 | 439 |
| Engineering | 63 | 50 | 34 | 23 | 40 |
| Graduate School | 87 | 64 | 66 | 40 | 47 |
| Liberal Arts | 32 | 35 | 33 | 35 | 41 |
| Nursing | 87 | 97 | 118 | 128 | 134 |
| Science | 99 | 82 | 79 | 55 | 43 |
| Total | 1,121 | 1,001 | 927 | 843 | 819 |
Spring 2014 Enrollment by College and Department
| College | Department Name | Undergraduate | Graduate | Total |
| Business | Accounting, Fin, & Economics | 341 | 341 | |
| Mgmt, Marketing and Bus Admin. | 480 | 63 | 543 | |
| College of Business Total | 821 | 63 | 884 | |
| Continuing Education | Continuing Education | 650 | 12 | 662 |
| Continuing Education Total | 650 | 12 | 662 | |
| Education | Education Professions | 360 | 360 | |
| Graduate Education Programs | 182 | 182 | ||
| Health & Human Performance | 436 | 43 | 479 | |
| Psychology | 299 | 71 | 370 | |
| Student Teaching & Field Experience | 143 | 143 | ||
| College of Education Total | 1,095 | 439 | 1,534 | |
| Engineering | Chemical, Civil, & Mechanical Engineering | 488 | 20 | 508 |
| Electrical Engineering & Computer Science | 287 | 20 | 307 | |
| College of Engineering Total | 775 | 40 | 815 | |
| General & Basic Studies | Basic Studies | 452 | 452 | |
| General & Basic Studies Total | 452 | 452 | ||
| Graduate School | Graduate School | 47 | 47 | |
| Graduate School Total | 47 | 47 | ||
| Liberal Arts | English & Foreign Languages | 109 | 32 | 141 |
| History | 108 | 108 | ||
| Mass Communication | 159 | 159 | ||
| Performing Arts | 97 | 97 | ||
| Social Sciences | 480 | 9 | 489 | |
| Visual Arts | 125 | 125 | ||
| College of Liberal Arts | 1,078 | 41 | 1,119 | |
| Nursing | Graduate Nursing | 134 | 134 | |
| Undergraduate Nursing | 1,027 | 1,027 | ||
| College of Nursing Total | 1,027 | 134 | 1,161 | |
| Science | Agricultural Sciences | 340 | 23 | 363 |
| Biology & Health Sciences | 448 | 448 | ||
| Chemistry & Physics | 92 | 7 | 99 | |
| Mathematical Sciences | 49 | 13 | 62 | |
| College of Science Total | 929 | 43 | 972 | |
| University Total | 6,827 | 819 | 7,646 |
Spring 2014 Undergraduate Enrollment by College and Department
| College | Department | Full-Time | Part-Time | Total |
| Business | Accounting, Fin, & Economics | 308 | 33 | 341 |
| Mgmt, Marketing and Bus Admin | 428 | 52 | 480 | |
| College of Business Total | 736 | 85 | 821 | |
| Continuing Education | Continuing Education | 12 | 638 | 650 |
| Continuing Education Total | 12 | 638 | 650 | |
| Education | Education Professions | 298 | 62 | 360 |
| Health & Human Performance | 406 | 30 | 436 | |
| Psychology | 263 | 36 | 299 | |
| College of Education Total | 967 | 128 | 1,095 | |
| Engineering | Chemical, Civil, & Mechanical Engineering | 427 | 61 | 488 |
| Electrical Engineering & Computer Science | 251 | 36 | 287 | |
| College of Engineering Total | 678 | 97 | 775 | |
| General & Basic Studies | Basic Studies | 361 | 91 | 452 |
| General & Basic Studies Total | 361 | 91 | 452 | |
| Liberal Arts | English & Foreign Languages | 101 | 8 | 109 |
| History | 93 | 15 | 108 | |
| Mass Communication | 150 | 9 | 159 | |
| Performing Arts | 89 | 8 | 97 | |
| Social Sciences | 428 | 52 | 480 | |
| Visual Arts | 108 | 17 | 125 | |
| College of Liberal Arts Total | 969 | 109 | 1,078 | |
| Nursing | Undergraduate Nursing | 813 | 214 | 1,027 |
| College of Nursing Total | 813 | 214 | 1,027 | |
| Science | Agricultural Sciences | 313 | 27 | 340 |
| Biology & Health Sciences | 402 | 46 | 448 | |
| Chemistry & Physics | 86 | 6 | 92 | |
| Mathematical Sciences | 40 | 9 | 49 | |
| College of Science Total | 841 | 88 | 929 | |
| University Total | 5,377 | 1,450 | 6,827 |
Spring 2014 Graduate Enrollment by College and Department
| College | Department Name | Full-Time | Part-Time | Total |
| Business | Mgmt, Marketing and Bus Admin | 43 | 20 | 63 |
| College of Business Total | 43 | 20 | 63 | |
| Continuing Education | Continuing Education | 12 | 12 | |
| Continuing Education Total | Graduate Education Programs | 56 | 126 | 182 |
| Health & Human Performance | 33 | 10 | 43 | |
| Psychology | 51 | 20 | 71 | |
| Student Teaching & Field Experience | 30 | 113 | 143 | |
| College of Education Total | 170 | 269 | 439 | |
| Engineering | Chemical, Civil, & Mechanical Engineering | 14 | 6 | 20 |
| Electrical Engineering & Computer Science | 17 | 3 | 20 | |
| College of Engineering Total | 31 | 9 | 40 | |
| Graduate School | Graduate School | 9 | 38 | 47 |
| Graduate School Total | 9 | 38 | 47 | |
| Liberal Arts | English & Foreign Languages | 26 | 6 | 32 |
| Social Sciences | 4 | 5 | 9 | |
| College of Liberal Arts Total | 30 | 11 | 41 | |
| Nursing | Graduate Nursing | 22 | 112 | 134 |
| College of Nursing Total | 22 | 112 | 134 | |
| Science | Agricultural Sciences | 12 | 11 | 23 |
| Chemistry & Physics | 5 | 2 | 7 | |
| Mathematical Sciences | 7 | 6 | 13 | |
| College of Science Total | 24 | 19 | 43 | |
| University Total | 329 | 490 | 819 |
Historical Spring Undergraduate Enrollment by College and Department
| College | Department Name | 2010 | 2011 | 2012 | 2013 | 2014 |
| Business | Accounting, Fin, & Economics | 340 | 348 | 347 | 332 | 341 |
| Mgmt, Marketing & Bus Admin | 452 | 471 | 445 | 454 | 480 | |
| College of Business Total | 792 | 819 | 792 | 786 | 821 | |
| Continuing Education | Continuing Education | 435 | 670 | 600 | 604 | 650 |
| Continuing Education Total | 435 | 670 | 600 | 604 | 650 | |
| Education | Educ Leadership & Instr Tech | 33 | 30 | |||
| Education Professions | 445 | 381 | 360 | |||
| Health & Human Performance | 393 | 438 | 447 | 422 | 436 | |
| Psychology | 219 | 245 | 276 | 260 | 299 | |
| Teacher Education | 530 | 475 | ||||
| College of Education Total | 1,175 | 1,188 | 1,168 | 1,063 | 1,095 | |
| Engineering & Engineering Technology | Engineering | 402 | 455 | 468 | 520 | |
| Engineering Technology | 132 | 104 | 121 | 107 | ||
| College of Engineering & Engineering Technology Total | 534 | 559 | 589 | 627 | ||
| Engineering | Chemical, Civil, & Mechanical Engineering | 488 | ||||
| Electrical Engineering & Computer Science | 287 | |||||
| College of Engineering Total | 775 | |||||
| General & Basic Studies | Basic Studies | 627 | 573 | 548 | 547 | 452 |
| General & Basic Studies Total | 627 | 573 | 548 | 547 | 452 | |
| Liberal Arts | English & Foreign Languages | 146 | 152 | 158 | 106 | 109 |
| History | 142 | 140 | 144 | 110 | 108 | |
| Mass Communication | 156 | 180 | 172 | 152 | 159 | |
| Performing Arts | 107 | 124 | 102 | 120 | 97 | |
| Social Sciences | 368 | 370 | 545 | 525 | 480 | |
| Visual Arts | 181 | 170 | 154 | 151 | 125 | |
| College of Liberal Arts Total | 1,100 | 1,136 | 1,275 | 1,164 | 1,078 | |
| Nursing | Undergraduate Nursing | 1,169 | 1,180 | 1,124 | 1,071 | 1,027 |
| College of Nursing Total | 1,169 | 1,180 | 1,124 | 1,071 | 1,027 | |
| Science | Agricultural Sciences | 283 | 301 | 334 | 333 | 340 |
| Biology & Health Sciences | 470 | 496 | 510 | 487 | 448 | |
| Chemistry | 100 | 74 | 89 | 88 | ||
| Chemistry & Physics | 92 | |||||
| Math, Computer Science, & Stat | 169 | 174 | 175 | 154 | ||
| Mathematical Sciences | 49 | |||||
| Nutrition & Family Studies | 109 | 129 | ||||
| Physics | 15 | 13 | 5 | |||
| College of Science Total | 1,146 | 1,187 | 1,113 | 1,062 | 929 | |
| University Total | 6,978 | 7,312 | 7,209 | 6,924 | 6,827 |
%In Fall 2011 Nutrition and Family Studies was split between Social Sciences and Agriculture.
~In Fall 2012 Chemistry and Physics were combined into Chemistry & Physics.
(&)In Fall 2013 the College of Engineering & Engineering Technology was changed to the College of Engineering.
$In Fall 2013 Engineering was changed to Chemical, Civil, & Mechanical Engineering. The Electrical Engineering concentration was moved to Electrical Engineering & Computer Science.
!In Fall 2013 Engineering Technology was changed to Electrical Engineering & Computer Science.
In Fall 2013 Math, Computer Science, and Statistics was changed to Mathematical Sciences. The Computer Science program was moved to Electrical Engineering & Computer Science.
Historical Spring Graduate Enrollment by College and Department
| College | Department Name | 2010 | 2011 | 2012 | 2013 | 2014 |
| Business | Mgmt, Marketing & Bus Admin | 89 | 75 | 65 | 74 | 63 |
| College of Business Total | 89 | 75 | 65 | 74 | 63 | |
| Continuing Education | Continuing Education | 16 | 13 | 10 | 16 | 12 |
| Continuing Education Total | 16 | 13 | 10 | 16 | 12 | |
| Education | Educ Leadership & Istr Tech | 135 | 98 | |||
| Graduate Education Program | 292 | 228 | 182 | |||
| Health & Human Performance | 32 | 37 | 39 | 40 | 43 | |
| Psychology | 59 | 76 | 76 | 54 | 71 | |
| Teacher Education | 422 | 374 | ||||
| Student Teaching & Field Experience | 115 | 120 | 143 | |||
| College of Education Total | 648 | 585 | 522 | 472 | 439 | |
| Engineering & Engineering Technology | Engineering | 63 | 50 | 34 | 23 | |
| Engineering & Engineering Technology Total | 63 | 50 | 34 | 23 | ||
| Engineering | Chemical, Civil, & Mechanical Engineering | 20 | ||||
| Electrical Engineering & Computer Science | 20 | |||||
| College of Engineering Total | 40 | |||||
| Graduate School | Graduate School | 87 | 64 | 66 | 40 | 47 |
| Graduate School Total | 87 | 64 | 66 | 40 | 47 | |
| Liberal Arts | English & Foreign Languages | 30 | 35 | 33 | 35 | 32 |
| Performing Arts | 2 | |||||
| Social Sciences | 9 | |||||
| College of Liberal Arts Total | 32 | 35 | 33 | 35 | 41 | |
| Nursing | Graduate Nursing | 87 | 97 | 118 | 128 | 134 |
| College of Nursing Total | 87 | 97 | 118 | 128 | 134 | |
| Science | Agricultural Sciences | 33 | 31 | 36 | 24 | 23 |
| Biological & Envr Sciences | ||||||
| Chemistry & Physics | 20 | 21 | 19 | 8 | 7 | |
| Math, Computer Science, & Stat | 46 | 30 | 24 | 23 | ||
| Mathematical Sciences | 13 | |||||
| College of Science Total | 99 | 82 | 79 | 55 | 43 | |
| University Total | 1,121 | 1,001 | 927 | 843 | 819 |
$In Fall 2013 Engineering was changed to Chemical, Civil, & Mechanical Engineering. The Electrical Engineering concentration was moved to Electrical Engineering & Computer Science.
In Fall 2013 Math, Computer Science, and Statistics was changed to Mathematical Sciences. The Computer Science program was moved to Electrical Engineering & Computer Science.
Spring 2014 Enrollment by Department and Major
| College/Department | Major | Undergraduate | Graduate | Total |
| Business | ||||
| Accounting, Fin & Economics | Accounting | 255 | 255 | |
| Finance | 82 | 82 | ||
| Undeclared | 4 | 4 | ||
| Department Total | 341 | 341 | ||
| Mgmt, Marketing, & Bus Admin | Business Administration | 63 | 63 | |
| Gen Business Administration | 165 | 165 | ||
| Management | 157 | 157 | ||
| Management Online | 75 | 75 | ||
| Marketing | 82 | 82 | ||
| Undeclared | 1 | 1 | ||
| Department Total | 480 | 63 | 543 | |
| College of Business Total | 821 | 63 | 884 | |
| Continuing Education | ||||
| Continuing Education | EASE Program | 4 | 12 | 16 |
| High School Early Admissions | 646 | 646 | ||
| Department Total | 650 | 12 | 662 | |
| Continuing Education Total | 650 | 12 | 662 | |
| Education | ||||
| Education Professions | Business Education Grades 6-12 | 5 | 5 | |
| Early Childhood Education | 1 | 1 | ||
| Early Childhood Educ Grades PK-3 | 175 | 175 | ||
| Elementary Education Grades 1-5 | 166 | 166 | ||
| Secondary Education and Teaching | 12 | 12 | ||
| Undeclared | 1 | 1 | ||
| Department Total | 360 | 360 | ||
| Graduate Education Programs | Counseling Gr K-12 | 2 | 1 | |
| Curriculum & Instruction | 11 | 11 | ||
| Educational Technology Leadership | 7 | 7 | ||
| Educational Diagnostician | 1 | 1 | ||
| Educational Leadership | 64 | 64 | ||
| Elementary Education Grades 1-5 | 21 | 21 | ||
| Instructional Technology | 18 | 18 | ||
| Reading Specialist | 3 | 3 | ||
| School Counseling | 22 | 22 | ||
| Secondary Education Grades 6-12 | 32 | 32 | ||
| Special Education | 2 | 2 | ||
| Department Total | 182 | 182 | ||
| Health & Human Performance | Athletic Training | 65 | 65 | |
| Health & Human Perfomance | 43 | 43 | ||
| Health & Human Performance, General | 258 | 258 | ||
| Heath & Physical Education, Gr K-12 | 108 | 108 | ||
| Undeclared | 5 | 5 | ||
| Department Total | 436 | 43 | 479 | |
| Psychology | Psychology | 298 | 71 | 369 |
| Undeclared | 1 | 1 | ||
| Department Total | 299 | 71 | 370 | |
| Student Teaching and Field Experience | Add-On Teacher Certification | 9 | 9 | |
| Alt Cert-Grades K-12 HP Ed | 2 | 2 | ||
| Alt Certification Grades 1-5 | 1 | 1 | ||
| Early Childhood Education Gr PK-3 | 19 | 19 | ||
| Elementary Education Gr 1-5 | 24 | 24 | ||
| ICrt-Early Childhood Ed Gr PK-3 | 4 | 4 | ||
| ICrt-Early Elementary Ed Gr 1-5 | 12 | 12 | ||
| ICrt-Mid Sch Ed Gr 4-8 [Sci] | 1 | 1 | ||
| ICrt-Mult Lvls Gr K-12 [Art] | 1 | 1 | ||
| ICrt-Mult Lvls Gr K-12 [HHP] | 2 | 2 | ||
| ICrt-Sec Ed Gr 6-12 [Biol] | 1 | 1 | ||
| ICrt-Sec Ed Gr 6-12 [Busi] | 1 | 1 | ||
| ICrt-Sec Ed Gr 6-12 [Engl] | 1 | 1 | ||
| ICrt-Sec Ed Gr 6-12 [Gen Sci] | 2 | 2 | ||
| ICrt- Sec Ed GR 6-12 [Soc Std] | 2 | 2 | ||
| Middle School Ed Gr 4-8 [Math] | 5 | 5 | ||
| Multiple Levels Gr K-12 [Art] | 2 | 2 | ||
| Multiple Levels Gr K-12 [HHP] | 11 | 11 | ||
| Multiple Levels Gr K-12 [Musc] | 1 | 1 | ||
| School Librarian | 12 | 12 | ||
| Secondary ED Gr 6-12 [Biol] | 1 | 1 | ||
| Secondary Ed Gr 6-12 [Busi] | 1 | 1 | ||
| Secondary Ed Gr 6-12 [Chem] | 1 | 1 | ||
| Secondary Ed Gr 6-12 [Engl] | 1 | 1 | ||
| Secondary Ed Gr 6-12 [Gen Sci] | 3 | 3 | ||
| Secondary Ed Gr 6-12 [Math] | 7 | 7 | ||
| Secondary Ed Gr 6-12 [Soc Std] | 6 | 6 | ||
| Spec Ed M/Mod Elem Ed Gr 1-5 | 3 | 3 | ||
| Spec Ed M/Mod Second Ed Gr 6-12 | 2 | 2 | ||
| Spec Ed Early Interv: Birth-5 | 5 | 5 | ||
| Department Total | 143 | 143 | ||
| College of Education Total | 1,095 | 439 | 1,534 | |
| Engineering | ||||
| Chemical, Civil, & Mechanical Engineering | Engineering | 487 | 20 | 507 |
| Undeclared | 1 | 1 | ||
| Department Total | 488 | 20 | 507 | |
| Electrical Engineering & Computer Science | Computer Info Technology | 5 | 5 | |
| Computer Science | 117 | 117 | ||
| Engineering | 85 | 7 | 92 | |
| Engineering Technology | 80 | 80 | ||
| Mathematical Sciences | 13 | 13 | ||
| Department Total | 287 | 20 | 307 | |
| College of Engineering Total | 775 | 40 | 815 | |
| General & Basic Studies | ||||
| Basic studies | Basic Studies | 52 | 52 | |
| General Studies | 394 | 394 | ||
| Organizational Leadership | 3 | 3 | ||
| Undeclared | 3 | 3 | ||
| Department Total | 452 | 452 | ||
| General & Basic Studies Total | 452 | 452 | ||
| Graduate School | Non-Degree | 47 | 47 | |
| Department Total | 47 | 47 | ||
| Graduate School Total | 47 | 47 | ||
| Liberal Arts | ||||
| English & Foreign Languages | Creative Writing | 22 | 22 | |
| English | 86 | 10 | 96 | |
| English Education Grades 6-12 | 4 | 4 | ||
| Foreign Language Education Gr 6-12 | 1 | 1 | ||
| Foreign Languages | 17 | 17 | ||
| Undeclared | 1 | 1 | ||
| Department Total | 109 | 32 | 141 | |
| History | History | 73 | 73 | |
| Liberal Studies | 33 | 33 | ||
| Social Studies Education Gr 6-12 | 2 | 2 | ||
| Department Total | 108 | 108 | ||
| Mass Communication | Mass Communication | 159 | 159 | |
| Department Total | 159 | 159 | ||
| Performing Arts | Music | 76 | 76 | |
| Music Educ- Instrumental, Gr K-12 | 13 | 13 | ||
| Music Educ- Vocal, Gr K-12 | 5 | 5 | ||
| Music Performance | 1 | 1 | ||
| Theatre Arts | 2 | 2 | ||
| Department Total | 97 | 97 | ||
| Social Sciences | Criminal Justice | 143 | 143 | |
| Criminal Justice Online | 76 | 9 | 85 | |
| Family and Consumer Sciences | 1 | 1 | ||
| General Studies | 2 | 2 | ||
| Paralegal Studies | 18 | 18 | ||
| Political Science | 37 | 37 | ||
| Sociology | 61 | 61 | ||
| Sociology Online | 142 | 142 | ||
| Department Total | 480 | 9 | 489 | |
| Visual Arts | Art | 120 | 120 | |
| Art Education- Grades K-12 | 1 | 1 | ||
| Gen Studies | 3 | 3 | ||
| Undeclared | 1 | 1 | ||
| Department Total | 125 | 125 | ||
| College of Liberal Arts Total | 1,078 | 41 | 1,119 | |
| Nursing | ||||
| Graduate Nursing | Nursing | 134 | 134 | |
| Department Total | 134 | 134 | ||
| Undergraduate Nursing | Nursing | 973 | 973 | |
| Nursing Online | 53 | 53 | ||
| Undeclared | 1 | 1 | ||
| Department Total | 1,027 | 1,027 | ||
| College of Nursing Total | 1,027 | 134 | 1,161 | |
| Science | ||||
| Agricultural Sciences | Agricultural Education- Grades 6-12 | 3 | 3 | |
| Agricultural Sciences | 246 | 246 | ||
| Environ & Chemical Sciences | 23 | 23 | ||
| Family & Consumer Sciences | 2 | 2 | ||
| Natural Resource Conservation Mgmt | 50 | 50 | ||
| Nutrition and Food Sciences | 37 | 37 | ||
| Secondary Education and Teaching | 1 | 1 | ||
| Undeclared | 1 | 1 | ||
| Department Total | 340 | 23 | 363 | |
| Biology & Health Sciences | Biological Science | 211 | 211 | |
| Biology Education Grades- 6-12 | 1 | 1 | ||
| Clinical Laboratory Science | 63 | 63 | ||
| Radiologic Sciences | 169 | 169 | ||
| Undeclared | 4 | 4 | ||
| Department Total | 448 | 448 | ||
| Chemistry & Physics | Chemistry | 87 | 87 | |
| Environmental & Chemical Sciences | 7 | 7 | ||
| Mathematical Sciences | 2 | 2 | ||
| Secondary Education and Teaching | 2 | 2 | ||
| Undeclared | 1 | 1 | ||
| Department Total | 92 | 7 | 99 | |
| Mathematical Sciences | Mathematical Sciences | 49 | 13 | 62 |
| Department Total | 49 | 13 | 62 | |
| College of Science Total | 929 | 43 | 972 | |
| University Total | 6,827 | 819 | 7,656 |