2012-2013 Degrees Conferred
Degrees Conferred July 1, 2012 – June 30, 2013
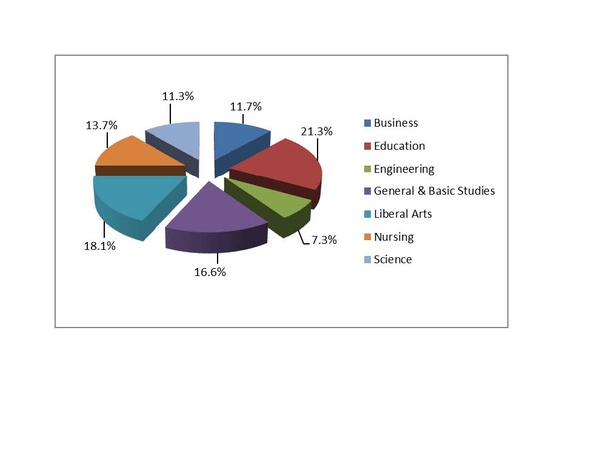
Degrees Conferred by College and Level
| Associate | Bachelor’s | Master’s | Education Specialist | Post Bach Cert. | Total | |
| Business | 160 | 29 | 189 | |||
| Education | 169 | 147 | 2 | 25 | 343 | |
| Engineering | 24 | 83 | 10 | 117 | ||
| General & Basic Studies | 55 | 179 | 34 | 268 | ||
| Liberal Arts | 28 | 246 | 17 | 291 | ||
| Nursing | 30 | 191 | 221 | |||
| Science | 5 | 149 | 28 | 182 | ||
| Total | 142 | 1,177 | 265 | 2 | 25 | 1,611 |
Degrees Conferred by College
Historical Degrees Conferred by College
| 08-09 | 09-10 | 10-11 | 11-12 | 12-13 | |
| Business | 213 | 196 | 179 | 193 | 189 |
| Education | 302 | 271 | 360 | 344 | 343 |
| Engineering & Engineering Technology | 122 | 114 | 129 | 113 | 117 |
| General & Basic Studies | 218 | 205 | 238 | 220 | 268 |
| Liberal Arts | 194 | 228 | 237 | 280 | 291 |
| Nursing | 227 | 208 | 192 | 177 | 221 |
| Science | 189 | 183 | 183 | 208 | 182 |
| Total | 1,468 | 1,405 | 1,518 | 1,535 | 1,611 |
Historical Degrees Conferred by Level
| 08-09 | 09-10 | 10-11 | 11-12 | 12-13 | |
| Associate | 122 | 152 | 172 | 119 | 142 |
| Bachelor | 1,049 | 975 | 983 | 1,105 | 1,177 |
| Master | 297 | 275 | 327 | 283 | 265 |
| Education Specialist | 3 | 9 | 2 | 2 | |
| Post Bach Certification | 27 | 27 | 25 | ||
| Total | 1,468 | 1,405 | 1,518 | 1,535 | 1,611 |
2012-2013 Degrees Conferred by Gender and Ethnicity
| Female | Male | Total | |
| Amer Indian/ Alaska Native | 8 | 5 | 13 |
| Asian | 12 | 8 | 20 |
| Black | 177 | 79 | 256 |
| Foreign | 41 | 76 | 117 |
| Hispanic | 11 | 8 | 19 |
| White | 774 | 392 | 1,166 |
| Two or More Races | 9 | 5 | 14 |
| Race/Ethnicity Unknown | 5 | 1 | 6 |
| Total | 1,037 | 574 | 1,611 |
2012-2013 Degrees Conferred by Gender and Level
| Associate | Bachelor‘s | Master’s | Education Specialist | Post Bach Certification | Total | |
| Female | 94 | 744 | 173 | 2 | 24 | 1,037 |
| Male | 48 | 433 | 92 | 1 | 574 | |
| Total | 142 | 1,177 | 265 | 2 | 25 | 1,611 |
Historical Degrees Conferred by Gender
| 08-09 | 09-10 | 10-11 | 11-12 | 12-13 | |
| Female | 904 | 905 | 977 | 941 | 1,037 |
| Male | 564 | 500 | 541 | 594 | 574 |
| Total | 1,468 | 1,405 | 1,518 | 1,535 | 1,611 |
2012-2013 Degrees Conferred by Ethnicity and Level
| Associate | Bachelor’s | Master’s | Education Specialist | Post Bach Certification | Total | |
| Amer Indian/ Alaska Native | 1 | 9 | 2 | 1 | 13 | |
| Asian | 2 | 15 | 2 | 1 | 20 | |
| Black | 19 | 188 | 44 | 2 | 3 | 256 |
| Foreign | 8 | 73 | 36 | 117 | ||
| Hispanic | 1 | 16 | 2 | 19 | ||
| White | 111 | 858 | 177 | 20 | 1,166 | |
| Two or More Races | 12 | 2 | 14 | |||
| Race/Ethnicity Unknown | 6 | 6 | ||||
| Total | 142 | 1,177 | 265 | 2 | 25 | 1,611 |
Historical Degrees Conferred by Ethnicity
| 08-09 | 09-10 | 10-11 | 11-12 | 12-13 | |
| Amer Indian/Alaska Native | 6 | 8 | 6 | 9 | 13 |
| Asian | 19 | 18 | 20 | ||
| Asian/Pacific Islander | 12 | 18 | |||
| Black | 223 | 190 | 233 | 216 | 256 |
| Foreign | 127 | 100 | 115 | 122 | 117 |
| Hispanic | 17 | 21 | 24 | 23 | 19 |
| White | 1,075 | 1,063 | 1,108 | 1,133 | 1,166 |
| Two or More Races | 7 | 9 | 14 | ||
| Race/Ethnicity Unknown | 8 | 5 | 6 | 5 | 6 |
| Total | 1,468 | 1,405 | 1,518 | 1,535 | 1,611 |