
McNEESE STATE UNIVERSITY
Fall 2019 Full-Time Instructional Faculty by Rank
| Tenured | On Tenure Track | Not on Tenure Track | Total | Percent | |
|---|---|---|---|---|---|
| Professors | 55 | 55 | 20.8% | ||
| Associate Professors | 37 | 6 | 43 | 16.3% | |
| Assistant Professors | 33 | 68 | 12 | 113 | 42.8% |
| Instructors | 53 | 53 | 20.1% | ||
| Total | 125 | 74 | 65 | 264 | 100.0% |
Fall 2019 Full-Time Instructional Faculty by Highest Degree
| Tenured | On Tenure Track | Not on Tenure Track | Total | Percent | |
|---|---|---|---|---|---|
| Bachelors | 2 | 2 | 0.8% | ||
| Masters | 21 | 15 | 46 | 82 | 31.0% |
| Terminal Masters | 12 | 4 | 8 | 24 | 9.1% |
| Doctorate | 92 | 55 | 9 | 156 | 59.1% |
| Total | 125 | 74 | 65 | 264 | 100.0% |
Fall 2019 Full-Time Instructional Faculty by Race and Gender
| Men | Women | Total | Percent | |
|---|---|---|---|---|
| American Indian or Alaska Native | 1 | 1 | 0.4% | |
| Asian | 15 | 7 | 22 | 8.3% |
| Black, non-Hispanic | 4 | 7 | 11 | 4.1% |
| Foreign, Non-Resident Alien | 9 | 6 | 15 | 5.7% |
| Hispanic | 2 | 2 | 0.8% | |
| White, non-Hispanic | 98 | 113 | 211 | 79.9% |
| Two or more races | 1 | 1 | 0.4% | |
| Race/Ethnicity Unknown | 1 | 1 | 0.4% | |
| Total | 127 | 137 | 264 | 100.0% |
Fall 2019 Full-Time Instructional Faculty by Race and Gender
| 19-20 | 315.9 |
| 18-19 | 315.3 |
| 17-18 | 308.7 |
| 16-17 | 304.9 |
| 15-16 | 302.9 |
| 14-15 | 322.3 |
| 13-14 | 326.9 |
| 12-13 | 361.7 |
Fall 2019 Classes Taught by Faculty Type
| Lower Level | Upper Level | Graduate | Total | |
|---|---|---|---|---|
| Full-Time Faculty | 728 | 682 | 210 | 1,620 |
| Part-Time Faculty | 184 | 95 | 45 | 324 |
| Total | 912 | 777 | 255 | 1,944 |
Fall 2019 Employees by Occupational Activity
| Full-Time | Part-Time | Total | Percent | |
|---|---|---|---|---|
| Instructional Staff | 262 | 156 | 418 | 51.8% |
| Student and Academic Affairs and Other Education | 28 | 28 | 3.5% | |
| Management Occupations | 51 | 51 | 6.3% | |
| Business and Financial Occupations | 28 | 3 | 31 | 3.8% |
| Computer, Engineering, and Science Occupations | 25 | 25 | 3.1% | |
| Community, Social Service, Legal, Arts, Design, Entertainment, Sports and Media Occupations | 70 | 9 | 79 | 9.8% |
| Healthcare Occupations | 5 | 5 | 0.6% | |
| Service Occupations | 36 | 36 | 4.5% | |
| Office and Administrative Support Occupations | 112 | 2 | 114 | 14.1% |
| Production, Transportation, and Material Moving Occupations | 1 | 1 | 0.1% | |
| Natural Resources, Construction, and Maintenance Occupations | 18 | 1 | 19 | 2.4% |
| Total | 635 | 172 | 807 | 100.0% |
Fall 2019 Employees by Race and Gender
| Men | Women | Total | Percent | |
|---|---|---|---|---|
| American Indian or Alaska Native | 3 | 3 | 0.4% | |
| Asian | 20 | 11 | 31 | 3.9% |
| Black, non-Hispanic | 38 | 55 | 93 | 11.5% |
| Foreign, Non-Resident Alien | 9 | 9 | 18 | 2.2% |
| Hispanic | 8 | 8 | 1.0% | |
| White, Non-Hispanic | 269 | 376 | 645 | 79.9% |
| Two or more races | 1 | 3 | 4 | 0.5% |
| Race/Ethnicity Unknown | 2 | 3 | 5 | 0.6% |
| Total | 339 | 468 | 807 | 100.0% |
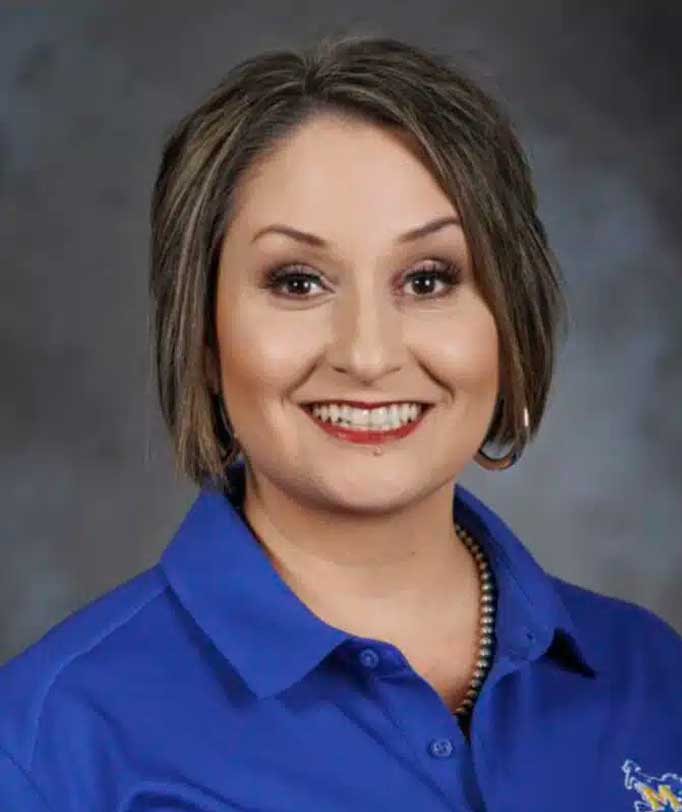
I am a McNeese graduate with a bachelor's degree in Family and Consumer Science and a concentration in Child and Family Studies. As a student, I competed on the rodeo team and served on the SGA board. I earned my master’s degree in 2022 from the University of South Dakota in Educational Administration and Leadership with a concentration in Adult and Higher Ed. I have over 13 years of experience in adult education and 20 years of educational experience.
My favorite part of being a Freshman Advisor is helping students navigate their new life routine as a college freshman by offering support with in-person office visits or by email to help students meet their goals. I always remind students of my favorite BB King quote – “Education is one thing no one can ever take away from you.” I believe that supporting students is vital to a student's success.
In my spare time, I raise registered American Brahman cattle, and I enjoy all the "country girl" things like hunting, fishing, growing a garden and cooking.